Gene expression profile and coexpression analysis
-
 Tools
Tools -
 Contribute
Warning : This article has been updated, you are now consulting an old release of this article!
The Gene Expression Tool is accessible from GenomicScape home page or by clicking here.
From a "Gene Expression Tool" page:
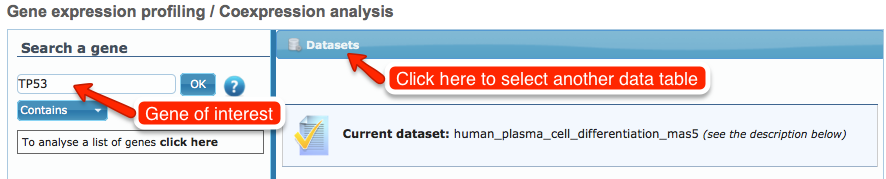
- Select a data table. For example “Datasets/healthy tissues or cells/B to plasma cells/Affy U133P2/Human plasma cell differentiation MAS5 (sample = 38)”
- Enter the name of your gene of interest in the search box and click OK button.
- GenomicScape returns a list of Affymetrix probe sets interrogating your gene of interest. These probesets are sorted according to their standard deviation in ascending order. For a given gene, the first probe set displayed is the probe set with the highest standard deviation.
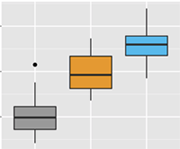
- Click on a gene name or on a probe set of interest to view th eexpression profile in the selected data table.
 Sign up
 Help
Help
 Author